Overview
Benthic invertebrates are a group of relatively small organisms that live the majority of their life cycles in or near bay bottom sediments. They are a food source for small fish and crustaceans and may provide some water quality benefits through sediment removal via filtration during feeding. Tampa Bay supports many different benthic organisms. The type of benthos varies depending on the salinity, sediment type, temperature, dissolved oxygen, and presence of excess nutrients and/or toxic contaminants.
The Tampa Bay Benthic Monitoring Program was started in 1993 and partners include the Environmental Protection Commission of Hillsborough County, and Hillsborough, Manatee and Pinellas Counties. Our partners monitor environmental conditions that affect benthic invertebrates, including percent silt-clay, sediment contaminant levels, and dissolved oxygen. Biological samples of organisms living in the benthos are also collected.
The Tampa Bay Benthic Index (TBBI) provides an estimate of the health of benthic communities in Tampa Bay. The TBBI is scaled from 0-100 with values <73 classified as “Degraded”, from 73-87 as “Intermediate”, and >87 as “Healthy”. These classifications are assigned to individual sampling stations in Tampa Bay. Collectively, bay segments are assigned to categories of Good, Fair, and Poor based on the distribution of classifications across all stations in each segment. This information provides a general summary of benthic community health across the bay, shown below as a report card.
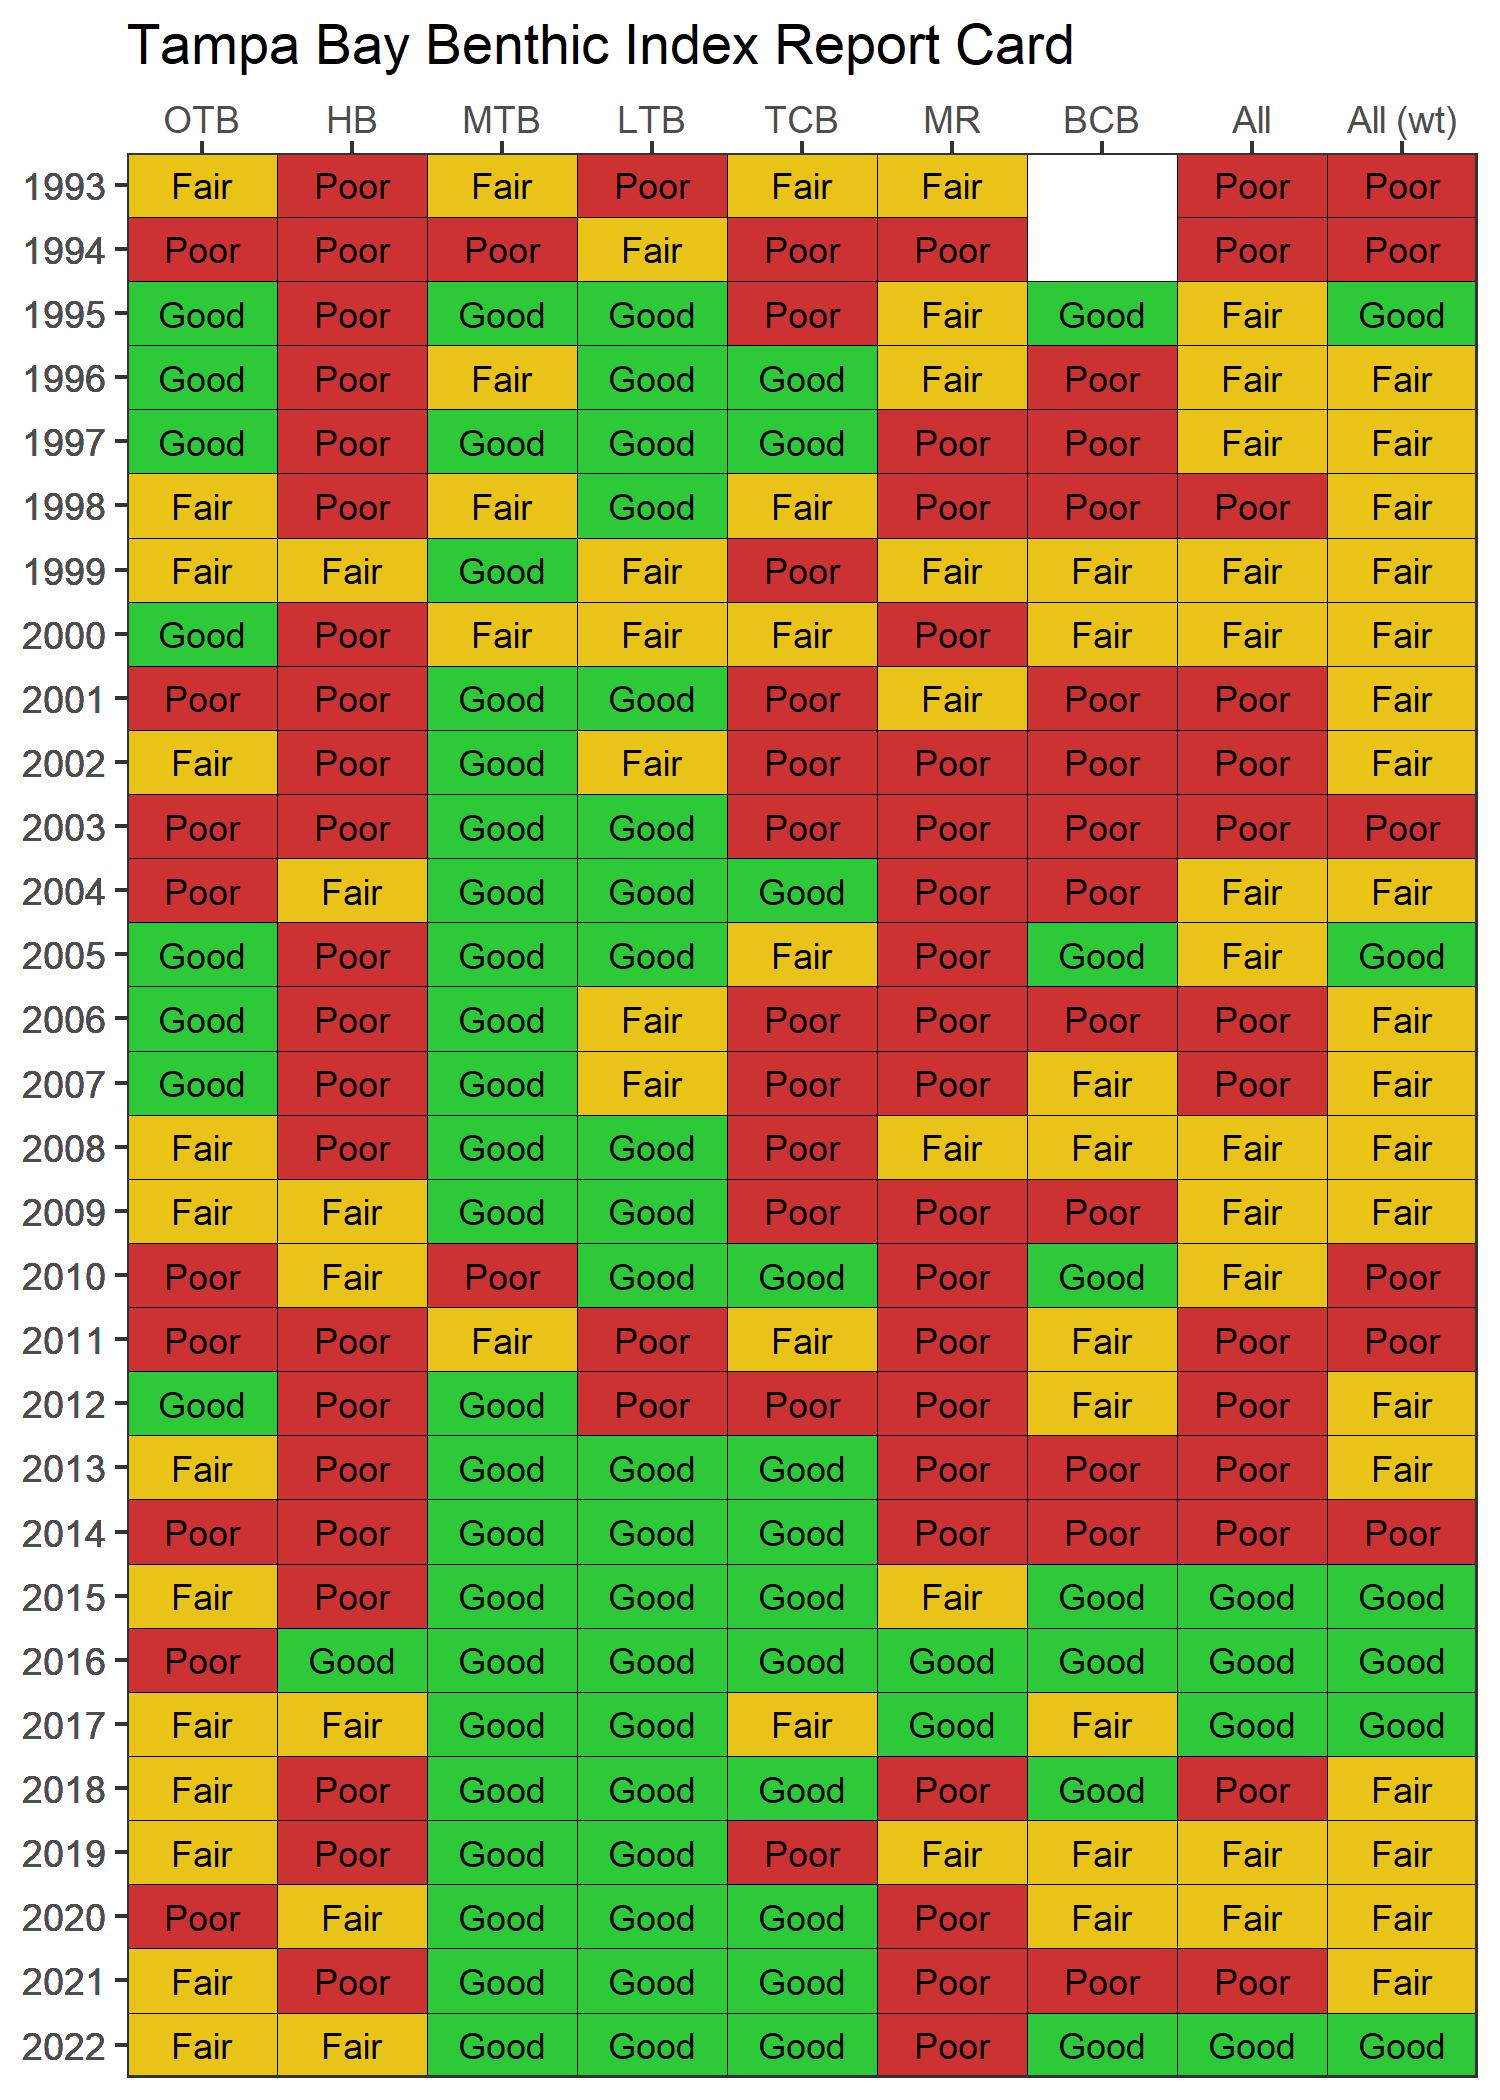
The Tampa Bay Benthic Index report card showing results for each year and major bay segments. Results are assigned to Hillsborough Bay (HB), Old Tampa Bay (OTB), Middle Tampa Bay (MTB), Lower Tampa Bay (LTB), Terra Ceia Bay (TCB), Manatee River (MR), Boca Ciega Bay (BCB), all segments (All), and all segments weighted by area (All wt).
A benthic dashboard created in Shiny is also available for a deeper dive into the data. Summaries are available for the TBBI, as well as information on sediment contaminants. Data downloads provide quick and easy access to the source information.

The interactive benthic dashboard
The tbeptools R package includes several functions to import data required for the index, analyze the data to calculate index scores, and plot the results to view trends over time. A detailed vignette is available on the tbeptools website that provides an overview of how to use the functions to calculate TBBI scores.


