Overview
Seagrass is an important habitat for fish and other marine animals. It stabilizes sediment, produces oxygen, and reduces shoreline erosion. The coverage, species, and condition of seagrass are significant indicators of ecosystem health in Tampa Bay. Over the past 40 years, reductions in nutrient pollution by partners throughout the watershed have significantly improved water clarity, leading to increases in seagrass.
Seagrass data for Tampa Bay are available as areal coverage maps or transect data. The coverage maps are produced approximately biennially from the Southwest Florida Water Management District. These maps are used by TBEP to assess progress in achieving acreage targets for seagrass restoration in each bay segment. The transect data are collected each year at over sixty locations in Tampa Bay and are available from the University of South Florida Water Atlas. Functions in the tbeptools R package can also be used to retrieve the transect data. At this time, the open science web products focus exclusively on the transect data.
The seagrass transect dashboard provides an interface to view and download results for all transect data in Tampa Bay. Dashboard assessments include an overall summary of seagrass trends by major bay segments and detailed results for individual transects.

The interactive seagrass transect dashboard
Similar to the water quality report card, the seagrass transect report card is an easily interpretable graphic showing status and trends of seagrasses in major segments of Tampa Bay. This graphic is also available from the dashboard. The numbers in each cell show the average frequency occurrence (0 – 100) across all species in each bay segment and year. The bay segments are Old Tampa Bay (OTB), Hillsborough Bay (HB), Middle Tampa Bay (MTB), Lower Tampa Bay (LTB), and Boca Ciega Bay (BCB), with the far left column showing the baywide total. Darker blues means higher frequency occurrence and healthier seagrass communities.
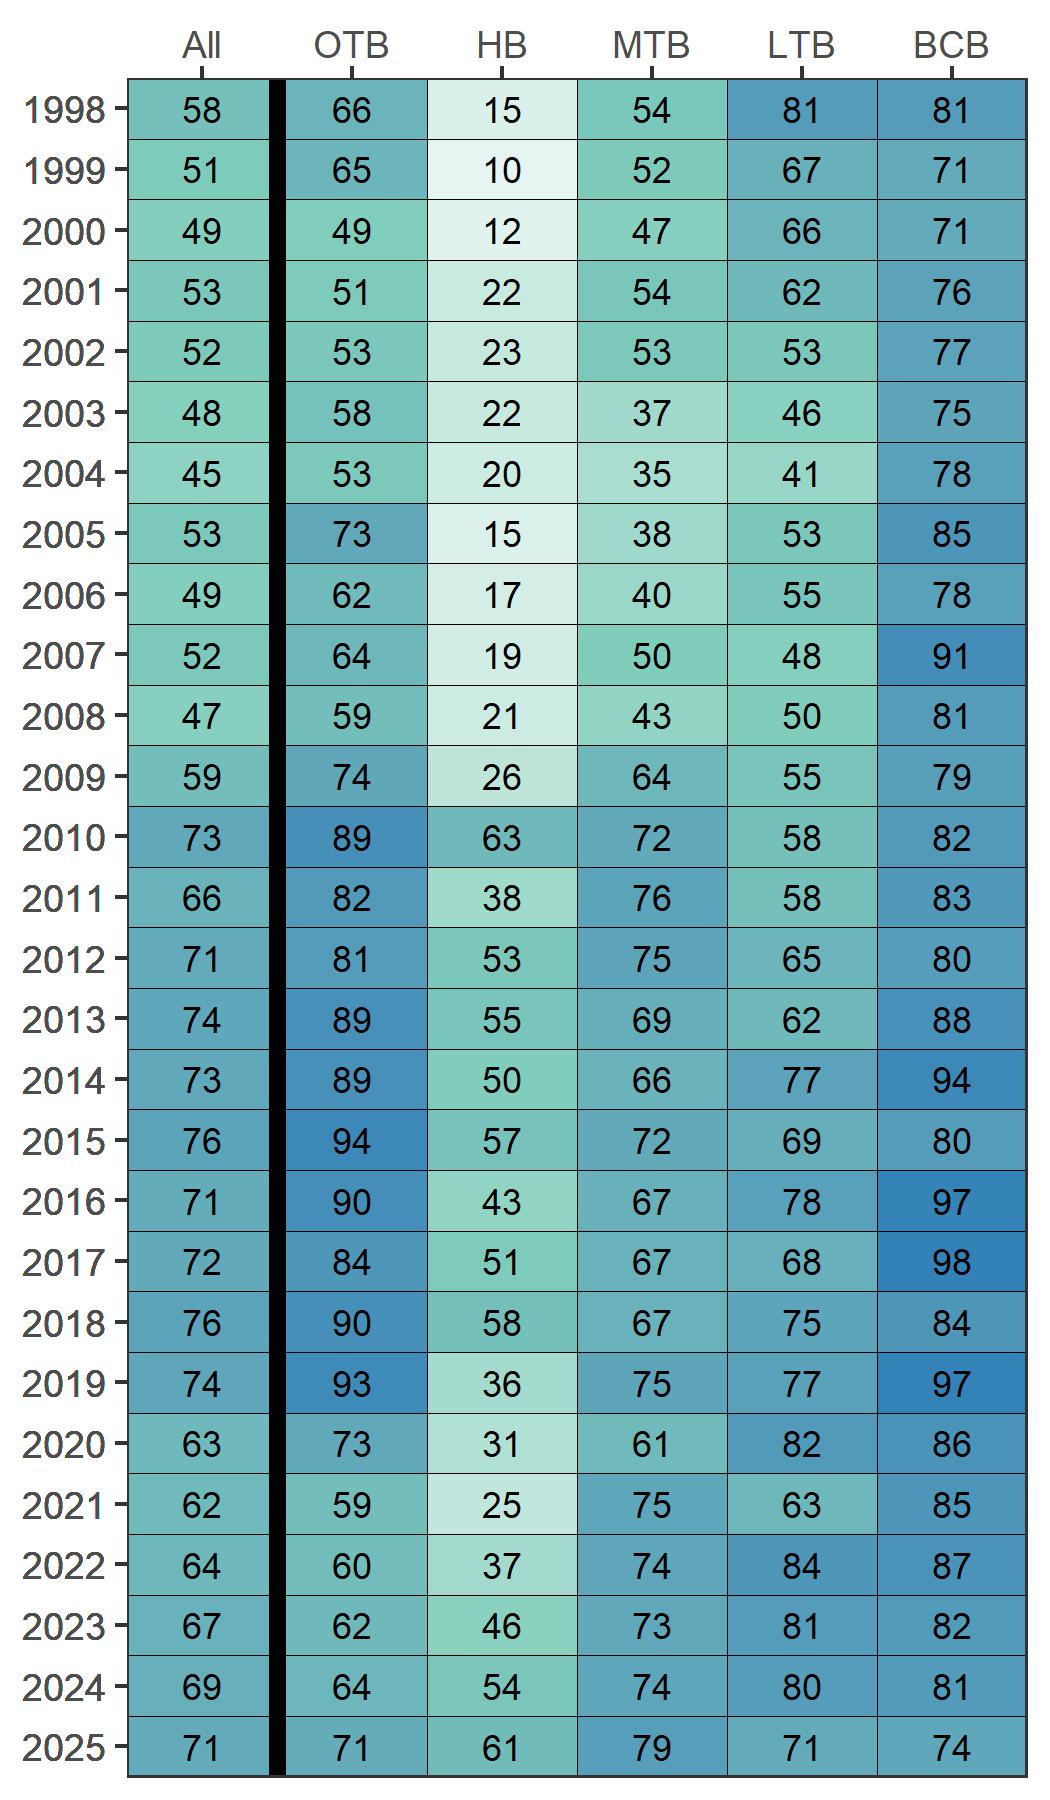
The seagrass transect report card
Additional information about the scoring methods for the transect data can be found in the dashboard and in the technical reports linked on the right.
Nearly all of the data, tables, and plots in the dashboard were created using functions using the tbeptools R software package. Please see the vignette for a detailed overview of how you can use these functions on your own to work with the data, including methods to import, summarize, and plot the transect data.


